

- What is payment analytics?
- Why payment analytics breaks down across several providers
- The 7 payment metrics that show where revenue leaks
- From payment data to a decision: a five-step method
- Payment analytics use cases
- How to build a payment analytics dashboard across providers
- Payment analytics software: three approaches and the tools
- How Akurateco puts payment data to work across providers
- Conclusion
Most enterprise merchants don’t lack payment data. They have a PSP dashboard for Europe, another for North America, an acquirer portal, a fraud tool and a folder of settlement files. Each one is accurate on its own terms. Put two of them side by side, though, and the numbers stop agreeing, because every provider counts attempts, names declines and reports fees its own way.
Payment analytics is the work of turning those separate reports into decisions: where to route a card type, which failed payments deserve a second try, which market is missing a local payment method. This guide covers what it is, the seven metrics that matter most, a five-step method for acting on them, how to build one view across providers, and how the main payment analytics software options compare. Demand for this kind of software keeps growing: SNS Insider valued the market at about USD 3.91 billion in 2025 and expects it to reach USD 6.48 billion by 2035.
TL;DR
- Analytics explains why payments succeed or fail and what to change. Reporting only tells you what happened.
- With more than one PSP or acquirer, the data has to be normalized before any comparison is fair. Statuses, decline codes, fees and settlement timing all differ between providers.
- Seven metrics carry most of the signal: approval rate, decline rate by code, retry success rate, chargeback rate, payment-method conversion by market, cost per successful transaction, and provider latency and errors.
- A five-step loop turns a metric into a decision: segment, find the cause, size the impact, test one change, check the net result.
- Tools fall into three groups: orchestration platforms, provider-native reporting and BI platforms. Orchestration platforms are the only group that can act on the data directly, by changing routing and retry rules.
What is payment analytics?
Payment analytics is the practice of collecting transaction data from every part of your payment stack, putting it into one consistent structure and using it to explain performance and decide what to change. The data comes from gateways, PSPs, acquirers, fraud tools, checkout and settlement reports. The output is a decision: move traffic, retry differently, add a method, tighten or relax a rule.
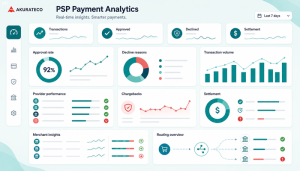
It’s often confused with reporting. A report tells you approvals fell in Germany last month. Analytics tells you the drop came from one acquirer, on one card brand, after an authentication rule changed, and what you could change to win those payments back.
| Payment reporting | Analytics | |
|---|---|---|
| Question it answers | What happened? | Why did it happen, and what should we change? |
| Typical output | Exports, monthly summaries, settlement reports | Patterns by provider, market and method, plus a decision to test |
| Who uses it | Finance and operations | Payments, finance, risk, product and leadership |
For a merchant with several providers, the questions usually sound like this:
- Which PSP or acquirer approves the most for each country and card brand?
- Are declines concentrated on one issuer group, currency or amount range?
- Which failed payments could a second provider have approved?
- Are fraud rules turning away good customers?
- Which markets lose buyers because a local payment method is missing?
Software that does this work, from a provider’s built-in reports to BI platforms and orchestration layers, is compared later in this guide.
Why payment analytics breaks down across several providers
Each PSP and acquirer reports in its own format, with its own definitions and its own timing, so their numbers can’t be compared as they arrive. With one provider this hardly matters, because its own dashboard is usually enough. Adding providers pays off in coverage and pricing, which is why many merchants run a multi-PSP setup in the first place. It also breaks the reporting, in six places:
- Formats and IDs. Data arrives as CSV exports, portal downloads or API responses, each with different field names. Transaction IDs rarely line up with your order IDs, so even matching one payment across two providers takes work.
- Decline codes and approval rates. Every provider maps issuer responses to its own reason codes, and some count a retry as a new attempt while others don’t. The same traffic can show two different approval rates.
- Settlement timing. Providers pay out on different schedules and batch fees differently, so a daily cash view built from several of them is always partly out of date.
- Missing fields. 3DS results, token usage, wallet type or the exact payment method are sometimes left out of exports altogether. Without them, you can’t see where authentication or a specific method causes failures.
- Fees. Pricing models and invoice formats differ, so the real cost of a payment can’t be compared line by line until every fee is mapped to the same categories.
- Manual merging. The fallback is a spreadsheet: exports from each portal, pasted together every week or month. By the time the numbers agree, the problem they point to is weeks old.
It helps to think of payment data in layers. Each layer lives in a different system and answers a different question:
| Data layer | Example data | What it tells you |
|---|---|---|
| Transaction layer | Authorization status, decline code, issuer response, card brand, 3DS result | Why payments are approved or fail |
| Provider layer | PSP, acquirer, MID, route, failover path | How each provider and route performs |
| Business layer | Legal entity, brand or storefront, market, customer segment | Where performance differs inside your own business |
| Finance layer | Fees, settlement batches, refunds, chargebacks, payouts | What payments really cost and whether the money arrived |
| Risk layer | Fraud rule triggers, chargeback rate, 3DS usage | How much good traffic your risk controls turn away |
| Checkout layer | Payment methods, checkout flow, retries, recurring payments | Which payment options and flows convert |
Consolidation is the fix: all of these layers, from every provider, in one structure, with statuses, codes, currencies and timestamps mapped the same way. The original provider responses stay available for investigations and disputes.
The 7 payment metrics that show where revenue leaks
Transaction volume and value tell you how big the business is. They don’t tell you where money is being lost. These seven metrics do, as long as each one is calculated the same way for every provider.
Approval rate
The share of payment attempts the issuer approves. It’s the headline number for most payment teams and the easiest one to get wrong across providers. Decide up front whether a retry counts as a new attempt, and whether blocks by your own fraud rules count as declines, then apply that rule everywhere.
Track it by provider, country and card brand, because the overall figure hides too much. A gap between two providers on the same slice of traffic is your first routing question.
Decline rate by code
The share of attempts declined, split by reason. The split matters more than the total. Group every provider’s codes into a small shared set: soft issuer declines (insufficient funds, “try again later”), hard issuer declines (closed account, stolen card), authentication failures, blocks by your own fraud rules, and technical errors such as timeouts.
Each group points somewhere different. Soft declines are retry candidates and hard declines are not. Authentication failures point at your 3DS setup, and technical errors point at the provider.
Retry success rate
Of the payments you retry, how many end up approved. Measure retries on the same provider separately from cascades, where a declined payment is sent to a second provider. The two behave very differently, and mixing them hides which one is working.
A low rate on hard declines is expected. If it’s low on soft declines too, your retry timing or your backup provider needs another look.
Chargeback rate
Chargebacks as a share of transactions over a period. Chargebacks arrive weeks after the sale, so count them against the month the transaction happened, not the month the dispute landed. Card networks run monitoring programs with their own thresholds and calculation rules, so check which definition your acquirers apply before you set internal targets.
Read it next to approval rate. Relaxing fraud rules lifts approvals; if chargebacks rise with them, the gain isn’t real.
Payment-method conversion by market
For each payment method in each country, the share of started payments that complete. Agree on where “started” begins, whether that’s the moment a buyer picks the method or the moment the payment page loads, and keep it fixed.
This is the metric that shows when a market is missing a local method, or when a method you added attracts buyers who then drop out.
Cost per successful transaction
Everything you pay to process, divided by the number of payments that actually succeed. That includes provider fees, the cost of retries and failed attempts, and chargeback fees. Map each provider’s invoice lines to the same fee types first, or you’ll be comparing different things.
It often changes the ranking. The provider with the lowest headline fee can come out more expensive once its extra declines and retries are counted.
Provider latency and technical error rate
How long each provider takes to respond, and how often it times out or returns an error. Watch the slow end of the response times, not only the average, since a small share of very slow responses is usually where timeouts start.
A rise here is a provider problem rather than an issuer one, and it’s the usual trigger for failing over to a backup route.
When one of these numbers moves, the next job is finding out why. A drop in approvals can come from issuer behavior, a route, a 3DS change, a new fraud rule, a provider outage or a change to your checkout. The method below narrows that down without guesswork.
From payment data to a decision: a five-step method
Most analytics setups stall at the same point: the dashboard shows a problem and nobody is sure what to do about it. This is the sequence we’d suggest for working through any drop in performance. Each step narrows the question for the next one.
1. Segment before you compare
Split the data by provider, country, payment method, card brand and amount range. An overall approval rate that looks healthy can hide one market or one acquirer doing badly, because strong segments pull the average up. You’re looking for the smallest slice where the change shows up clearly.
2. Find the cause
Separate issuer declines from fraud blocks, authentication failures, provider errors and timeouts. The pattern usually tells you which kind of action fits:
| Pattern | What the data shows | Possible action |
|---|---|---|
| Soft declines on one provider | The same kind of transaction goes through on another provider | Add a cascading rule for that segment |
| Declines rising for one issuer group | Declines cluster around an issuer country or BIN range | Change the route for those BINs |
| Failures after authentication | Payments fail more often after the 3DS step | Review the authentication setup |
| Timeouts and slow responses | Failures line up with provider response delays | Fail over to a backup route |
| Good customers blocked | Fraud rules reject payments that later prove legitimate | Adjust the rule thresholds |
| Repeated hard declines | Retries don’t recover anything | Stop retrying them and save the cost |
3. Size the revenue impact
Estimate what the problem costs before you fix it: the number of avoidable failed payments multiplied by your average order value, minus what it would cost to retry or reroute them. That keeps the team on the problems worth solving and gives you a number to check the fix against later.
4. Test one change
Change one thing for part of the traffic. Send a share of one card brand to another acquirer, adjust a single fraud rule, or add a payment method in one market. A travel merchant might find that one provider approves European Visa cards more often while another is stronger on US Mastercard; a controlled test is how that finding becomes a routing rule. Our guide covers how to set up routing rules from these signals.
5. Check the net result
Compare approval rate, cost, latency and chargebacks before and after, on the same segment. A route that lifts approvals but raises chargebacks isn’t an improvement, and neither is a cheaper route that adds timeouts. Keep the change only if the whole picture is better.
Payment analytics use cases
Each use case below starts from one of the metrics above and ends in a decision.
More revenue recovered from failed payments
Not every failed payment is lost. Soft declines, such as insufficient funds or a temporary issuer problem, often succeed on a second attempt, either later or through another provider. Hard declines almost never do, and retrying them only adds cost. Splitting failures by decline code and provider shows where retries tend to work, so you can send declined payments to a backup provider automatically for those segments only.
Subscription renewals follow the same logic. Knowing whether a failed renewal came from an expired card, an issuer decline or an authentication step tells you whether to retry, ask the customer to update their card, or change the route.
Higher approval rates in weak markets
A healthy global approval rate can sit on top of one country where it’s well below average. Segmenting by market and provider finds those pockets. The fix is often routing that market’s traffic, or one card brand within it, to an acquirer that performs better there, or adding local acquiring. For high-volume merchants, even a small gain in one large market adds up quickly.
Provider negotiations backed by evidence
With normalized data, conversations with your providers move from “your service has been worse lately” to specifics. A hypothetical example: “Your soft-decline rate on French Mastercard transactions above €150 was 12% higher than our other acquirer’s over the last 30 days.” A statement like that is hard to dismiss, and it gives both sides something concrete to fix. Compare providers only on equivalent traffic, though. A provider that handles your riskier segments will always look worse on raw averages.
Lower cost per successful payment
The cheapest provider on paper isn’t always the cheapest in practice. Once declines, retries, chargebacks and slower settlement are counted, a route with a higher fee can cost less per successful payment. Measuring cost this way lets you optimize for net revenue instead of the fee line alone.
Fewer lost customers at checkout
Payment-method data shows where buyers abandon checkout because the method they want isn’t offered, or because a method you do offer keeps failing. A marketplace that sees strong demand in a new country but weak payment completion may not have a demand problem at all. It may be missing a local method, or its acquirer may be declining local cards. The same data tells you which currencies to show and which methods deserve a more prominent spot at checkout.
Lower fraud and chargeback losses
Fraud data only makes sense next to approval data. Reviewing rule triggers, 3DS results and chargebacks together with approvals shows whether a rule is catching fraud or just turning away good customers. Change one rule at a time, and check chargebacks a few weeks later before you call it a success.
Faster reconciliation
Finance teams spend hours matching transactions, fees, refunds and payouts across provider portals. With the data in one place, fee differences, late payouts and missing records show up as exceptions during the month instead of surprises at month end, and that time goes back to work that actually needs a person.
How to build a payment analytics dashboard across providers
Most of the work in a dashboard happens before the first chart. With several providers, normalization comes first and the charts come last. Here is the order we’d follow:
- Connect the sources. PSP and gateway reports, acquirer files, your fraud tool, checkout events and settlement files. If you can, join payment data with your web analytics too, so you see buyers who leave before they reach the payment step, not only the ones who fail at it.
- Normalize. Map statuses, decline codes, currencies, fee types and timestamps to one structure, as described above. Keep the original provider responses; you’ll need them for disputes and escalations.
- Define the metrics once. Write down how each of the seven metrics is calculated and use the same definition in payments, finance and risk. Most arguments about numbers that don’t match start here.
- Build views per team. Payments operations needs approvals, declines and provider health by the hour. Finance needs fees, settlements, refunds and chargebacks. Risk needs rule triggers and 3DS results, and leadership needs the trend. Every view should let you drill down from a market to a single transaction.
- Set alerts and exports. Alerts for sudden approval drops or latency spikes, and exports to CSV, your BI tool or your ERP for the analysis the dashboard doesn’t cover.
If you’d rather not build all of this yourself, you can start from a ready-made dashboard that covers the reporting side.
Mistakes to avoid
- Treating every decline the same instead of splitting by reason.
- Comparing providers without checking that they handle similar traffic.
- Showing volume without cost or margin, so the dashboard looks busy but says little about profit.
- Leaving settlement and reconciliation out until finance finds the gaps.
- Building views that can’t lead to a change in routing or rules.
Keep raw card data out of your analytics tools. Any system that stores or processes cardholder data falls within PCI DSS scope, so work with tokenized or masked data instead.
Payment analytics software: three approaches and the tools
Tools for this fall into three groups, and there is always the option of building your own. The groups aren’t mutually exclusive; larger merchants often use two of them together.
| Approach | What it does well | Where it falls short | Best when |
|---|---|---|---|
| Orchestration platform | Normalizes data across providers and connects it to routing, cascading and provider monitoring | Covers only the providers connected to it | You run several PSPs or acquirers in several markets and want to act on the data |
| Provider-native reporting | Knows its own statuses, decline reasons, disputes and settlements in detail | Sees only its own traffic | Most of your volume goes through one provider |
| BI platform | Combines payment data with finance, CRM and product data | Needs a payment data model that your team builds and maintains | You have a data team and a warehouse |
| Build in-house | Full control over the data model and dashboards | Expensive and slow; needs data engineers who understand payments | You are a large merchant with a mature data team |
Only the first group can act on what it finds. Because an orchestration layer sits between you and your providers, changing a route is a setting rather than a new integration. Many merchants pair it with a BI tool for analysis that goes beyond payments.
How we chose. We looked at five things: how well a tool understands payment data (decline codes, MIDs, disputes, settlements) without you building that from scratch; whether it combines data from several providers; access and exports for different teams, meaning role-based views for payments, finance and risk and export to BI or ERP; how it handles fees, settlements, refunds and disputes for reconciliation; and how much work it takes to deploy and run.
Akurateco publishes this overview and is one of the tools listed. Descriptions of other vendors are based on their public documentation, reviewed on September 25, 2026. Features, tiers and availability change, so confirm the details with each vendor before you buy. We did not run benchmarks across these platforms.
The ten tools below are grouped by approach, starting with orchestration platforms.
Orchestration platforms
1. Akurateco
Akurateco is a payment orchestration platform: the gateway and orchestration layer on top of your acquirers and PSPs. It doesn’t process transactions itself. Transaction data from every connected provider lands in one place, where you can segment it by provider, MID, country and payment method. Routing and cascading run in the same system, so a finding can go straight into a routing rule.
Best for:
- Merchants running several PSPs or acquirers in several markets who want one view of all of them.
- Payment teams that want analytics connected to routing and cascading, not in a separate BI layer.
Main limitation:
- It isn’t a general BI tool. For analysis beyond payments, you’d pair it with one.
2. Primer Observability
Primer Observability is the analytics layer of Primer’s orchestration platform. According to Primer, it standardizes payment data across processors and lets teams investigate processor performance and payment flows.
Best for:
- Merchants already routing payments through Primer.
- Teams that want to compare processors and trace where in the payment flow failures happen.
Main limitation:
- It’s built around Primer’s own platform, so it fits best if Primer already handles your routing.
Provider-native reporting
3. Stripe Sigma
Stripe’s documentation describes Sigma as an SQL environment inside Stripe for querying your Stripe data, including payments, subscriptions, payouts, refunds and disputes.
Best for:
- Merchants processing mainly through Stripe.
- Finance, operations and data teams that need custom reports on Stripe data.
Main limitation:
- It’s built around Stripe data. If you also use other PSPs or acquirers, you need another layer to bring their data together.
4. Adyen reporting
According to Adyen’s documentation, its reports cover transaction activity, settlements, invoices, conversion and disputes, for both operations and finance teams.
Best for:
- Merchants and marketplaces processing mainly through Adyen.
- Finance teams reconciling Adyen settlements and invoices.
Main limitation:
- Like any provider’s own reporting, it covers Adyen traffic only.
5. Checkout.com and ProcessOut
Checkout.com’s documentation covers declines, chargebacks, payment-method performance and transaction behavior, with custom views by card type, issuing bank, BIN, currency and payment method.
Checkout.com also owns ProcessOut, which it acquired in 2020 and which still runs as a separate, provider-agnostic orchestration platform with its own routing, monitoring and dashboard. That’s why the two names often appear side by side in comparisons.
Best for:
- Merchants processing mainly through Checkout.com.
- Teams focused on approval rates, chargebacks and payment-method performance.
Main limitation:
- Checkout.com’s own analytics cover its own traffic. A cross-provider view sits with ProcessOut, a separate product.
BI platforms
6. Microsoft Power BI
Power BI connects many data sources, supports governed data models and embedded reports, and scales across teams. It’s the obvious candidate if you already run on Microsoft.
Best for:
- Teams on Azure, Microsoft 365 or Fabric.
- Finance, operations and executive reporting.
Main limitation:
- Someone has to build and maintain the payment data model before it’s useful for payment operations.
7. Tableau
Tableau is strong on visual exploration and executive dashboards, with cloud-hosted and self-hosted deployment and governed analytics.
Best for:
- Teams that need polished executive reporting.
- Data teams that like to explore visually, especially in organizations already using Salesforce.
Main limitation:
- It isn’t payment-specific. You define the data model, the metrics and the context.
8. Looker
Looker’s documentation describes governed metrics, a semantic modeling layer (LookML) and embedded analytics, which help keep one definition of each metric across teams.
Best for:
- Teams on BigQuery or Google Cloud.
- Anyone who needs the same metric definitions in payments, finance and risk.
Main limitation:
- LookML needs technical ownership and ongoing maintenance.
9. Metabase
Metabase offers self-service dashboards, scheduled reports, permissions and embedded reporting, with less setup than the larger BI platforms.
Best for:
- Teams that want quick self-service reporting without much BI overhead.
Main limitation:
- You still build and maintain the payment data model and the integrations yourself.
10. Apache Superset
Apache Superset is open source: SQL-based exploration, dashboards, filters and connections to most databases, deployed and run by your own team.
Best for:
- Engineering-led data teams that want open-source control.
Main limitation:
- Hosting, security, upgrades and user support are on you.
Comparison table
| Tool / platform | Category | Best when… | Main strength | Main limitation |
|---|---|---|---|---|
| Akurateco | Payment orchestration | You need analytics connected to routing, cascading and provider monitoring across several providers | Payment-specific infrastructure and operational context | Not a standalone generic BI tool |
| Primer Observability | Orchestration / observability | You need processor performance and route insights | Links analytics to payment orchestration | Fit depends on infrastructure model |
| Stripe Sigma | Provider-native analytics | Stripe is a major processing channel | SQL access to Stripe data | Limited outside Stripe data |
| Adyen reporting | Provider-native reporting | Adyen is a key provider or acquirer | Payment lifecycle and settlement reports | Provider-specific visibility |
| Checkout.com and ProcessOut | Provider-native analytics; ProcessOut adds orchestration | Checkout.com is a key processing partner | Payment metrics with custom views by card, BIN and method | Cross-provider view needs ProcessOut |
| Power BI | General BI | You use Microsoft or Fabric and need enterprise reporting | Governance, scaling and Microsoft integration | Requires payment data modeling |
| Tableau | General BI | You need advanced visual analytics and executive dashboards | Visual exploration and enterprise reporting | Requires payment domain modeling |
| Looker | Semantic BI / embedded analytics | You need governed metrics and embedded analytics | LookML semantic layer and APIs | Requires technical setup |
| Metabase | Lightweight BI / embedded analytics | You need fast self-service dashboards | Easy deployment and usability | Less enterprise-heavy than Power BI, Tableau or Looker |
| Apache Superset | Open-source BI | You have engineering resources and want control | Open-source flexibility and SQL-first analytics | Requires maintenance |
Build vs buy
Building in-house gives you full control, but it is slow, and it only pays off with a data team that understands payments. Most merchants end up building selectively. Keep the analysis that’s specific to your business in-house, such as customer lifetime value or pricing models, and buy the layers that are expensive to maintain: provider connectivity, routing and standard payment reporting.
How Akurateco puts payment data to work across providers
Akurateco is the gateway and orchestration layer between you and your acquirers and PSPs, and it doesn’t process transactions itself. It connects you to 700+ integrations with acquirers, PSPs and payment methods.
That position matters for analytics. Data from every connected provider arrives in one system, so approvals, declines, refunds and chargebacks can be compared side by side. Routing and cascading run in the same place, which makes step 4 of the method a configuration change rather than a project. And the data is easy to take elsewhere, through CSV or XLS exports from the admin panel and API access for BI tools such as Power BI.
Conclusion
More providers bring coverage and resilience, and they also bring more reports that don’t agree. The fix starts with making the data comparable. After that, a handful of metrics and a simple test-and-check loop do most of the work. The right tool depends on how many providers you run and how much you want to build yourself. For enterprise merchants with several PSPs, an orchestration layer is usually the place to start, with a BI tool alongside it for deeper analysis.
Payment Analytics FAQ
What is payment analytics software?
Payment analytics software collects transaction data from your gateways, PSPs, acquirers and fraud tools, puts it into one structure and shows why payments succeed or fail. It ranges from a provider’s own reporting to BI platforms and orchestration platforms. Orchestration platforms can also act on the data, for example by changing routing or retry rules.
What are the best payment analytics tools?
It depends on your setup. If most of your volume runs through one provider, its own reporting (Stripe Sigma, Adyen, Checkout.com) may be enough. BI platforms such as Power BI, Tableau, Looker, Metabase and Superset suit teams with a data warehouse. Orchestration platforms such as Akurateco and Primer fit merchants that run several PSPs and want to act on the data.
Which payment metrics should you track first?
Start with approval rate and decline rate by code, split by provider, country and card brand. Then add retry success rate, chargeback rate, payment-method conversion by market, cost per successful transaction, and provider latency and error rate. Define each metric once and calculate it the same way for every provider, or the comparisons won’t hold.
What is the difference between payment analytics and payment reporting?
Reporting tells you what happened: volume, approvals and settlements for a period. Analytics explains why it happened and what to change. For example, it can show that approvals fell on one acquirer for one card brand after an authentication change, and that moving that traffic could fix it. Reporting is periodic; analytics feeds decisions you can test.
What is the difference between payment analytics tools and BI platforms?
Payment analytics tools understand payment-specific concepts such as decline codes, routing, MIDs, disputes, settlement batches, payment methods and provider performance. BI platforms are broader analytics systems that can visualize any business data, but teams must first build payment-specific data models, definitions and workflows.
Is a payment provider's own dashboard enough?
With one main provider, often yes. Its reporting covers statuses, declines, disputes and settlements for its own traffic. With several PSPs or acquirers, it isn’t: each dashboard shows only its own slice, with its own definitions. You need an orchestration platform or a BI layer to normalize the data before providers can be compared fairly.
What data do you need before payment analytics is useful?
You need consistent transaction-level data: payment status, MID, payment method, amount and currency, the processor or acquirer, decline codes, routing data, refunds, disputes, fees, settlements and payouts. If you work with several providers, these fields also need the same definitions everywhere, so performance can be compared across providers.
How much does payment analytics software cost?
Pricing varies by vendor and type. Tools are priced per transaction, per user, by subscription tier or on request for enterprise deployments. The final cost depends on transaction volume, number of users, data sources, integrations, hosting model and support level, plus the internal work to set up and maintain it. With BI tools, most of that work goes into data modeling.
Should you build payment analytics in-house?
Only if you have strong data engineering and payment expertise and need something no platform offers. For most merchants it works better to build selectively: keep business-specific analysis in-house and buy the layers that are expensive to maintain, such as provider connectivity, routing and standard reporting. The build vs buy section above compares the options.